Using 7050 aluminum alloy extrusion as an example to introduce single-stage aging, two-stage aging, and retrogression and re-aging
I. Single-Stage Aging
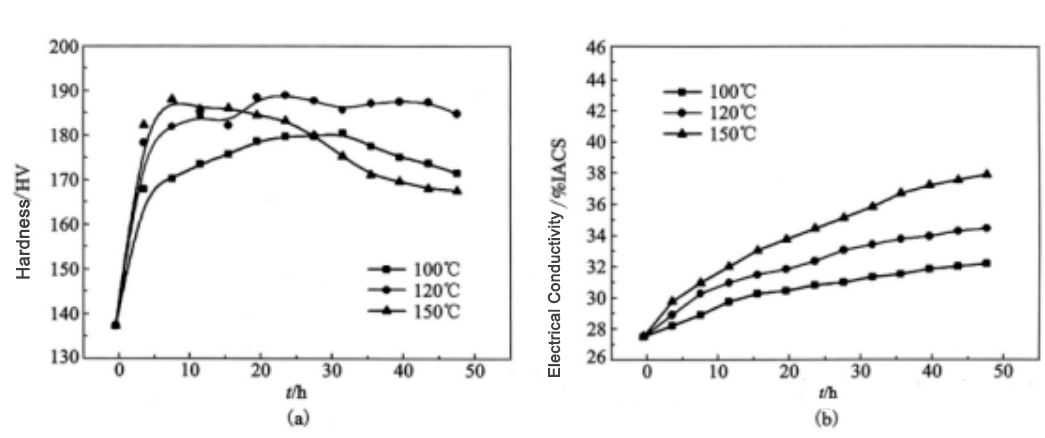
Figure 1 (a) Hardness and (b) electrical conductivity of the alloy as a function of aging time at different single-stage aging temperatures
1 Figure 1 shows the hardness and electrical conductivity change trends of 7050 aluminum alloy extruded bars after solution treatment at 475°C for 1 hour followed by quenching and then different single-stage aging treatments.
2 As seen in Figure 1(a), the alloy hardness increases rapidly at the initial stage of aging, showing an obvious age-hardening effect. With the extension of aging time, the hardness reaches a peak and then shows a decreasing trend, entering the over-aging stage.
3 Under different aging temperatures, the time for the alloy to reach peak hardness and the subsequent rate and degree of hardness decrease are different, that is, the age-hardening effect and resistance to over-aging are closely related to the aging temperature.
4 As can be seen from Figure 1(a), with increasing aging temperature, the rate of hardness increase at the initial aging stage accelerates significantly, and the aging time to reach peak hardness shortens. At aging temperatures of 100°C, 120°C and 150°C, the peak hardness of the alloy appears at 30 h, 24 h and 10 h, respectively. Within the temperature range of 100 to 150°C, the peak hardness of the alloy tends to increase with aging temperature. However, as the aging temperature increases, the rate of hardness decrease during over-aging is also faster.
5 At the same aging temperature, electrical conductivity shows a continuous increasing trend with the extension of aging time, and the higher the aging temperature, the faster the rate of increase of electrical conductivity.
6 Under single-stage aging at 120°C, the electrical conductivity of the alloy does not increase much with the extension of aging time, and this aging treatment does not significantly improve the corrosion resistance of the alloy.
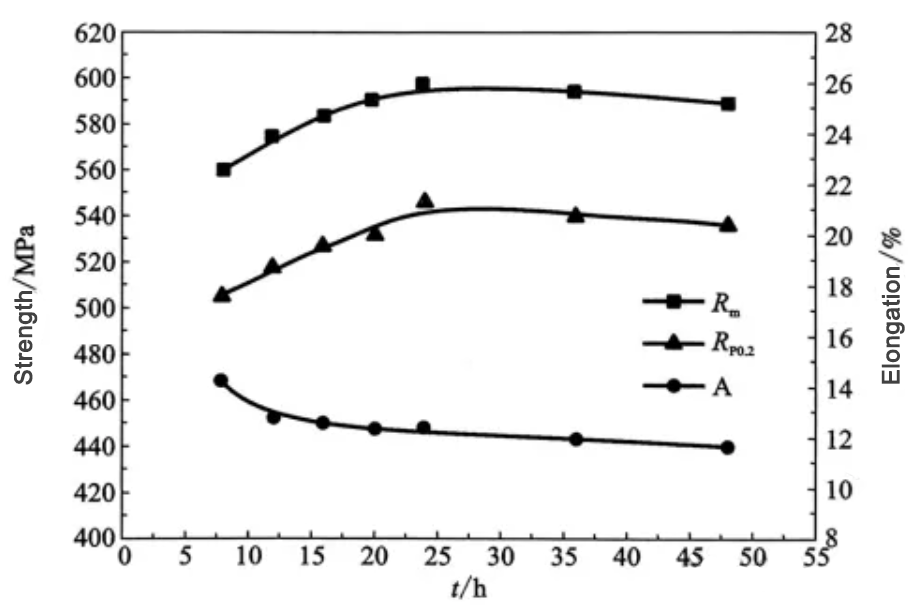
Figure 2 Tensile mechanical properties of the alloy after aging at 120°C for different times
7 Figure 2 shows the tensile mechanical properties of the alloy after solution treatment at 475°C for 1 hour followed by quenching and then aging at 120°C for different times.
8 With the extension of aging time, the change in alloy strength is similar to that of hardness. Obvious age strengthening occurs at the initial aging stage and reaches a peak at about 24 hours, then the alloy strength shows a slowly decreasing trend. With the extension of aging time, the elongation of the alloy slowly decreases.
9 Considering strength, plasticity and electrical conductivity comprehensively, the suitable single-stage peak aging treatment for 7050 aluminum alloy is 120°C/24 h. After this treatment, the ultimate tensile strength, yield strength and elongation are 597 MPa, 546 MPa and 12.3%, respectively, and the hardness and electrical conductivity are 190 HV and 32.4% IACS.
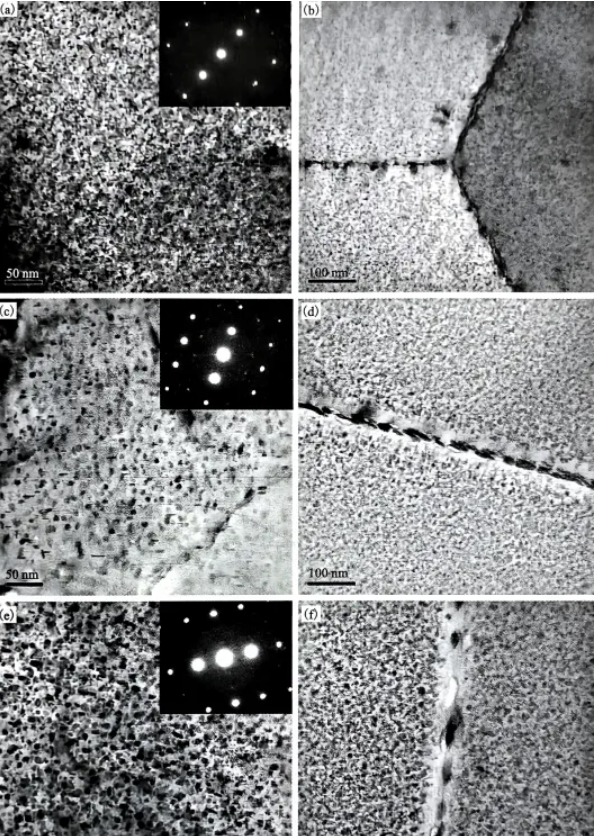
Figure 3 Transmission electron microscopy microstructures of the alloy after aging at 120°C for different times (a),(b) 2 h; (c),(d) 24 h; (e),(f) 48 h
10 Figure 3 shows the transmission electron microscopy microstructures of the alloy after aging at 120°C for different times. After short-term aging (Figure 3(a), 2 h), the precipitates inside the grains are fine η’ phases, and some areas are GP zones formed by solute atom enrichment.
11 After peak aging (Figure 3(c), 24 h), the intragranular precipitates are uniformly and dispersedly distributed, mainly η’ phases, with a precipitate size range of 3.6 to 6.1 nm. After 48 h over-aging (Figure 3(e)), the intragranular precipitates still maintain a high density, the number of η’ phases increases, and the particle size coarsens.
12 From the perspective of alloy grain boundary morphology and structure, with the extension of aging time, the grain boundary precipitates gradually increase in size and develop from a continuous chain-like distribution to a discontinuous distribution. After entering the over-aging stage, precipitate-free zones (PFZs) appear at the grain boundaries.
II. Two-Stage Aging
Relevant studies have shown that the first-stage aging in the two-stage aging process has little effect on the microstructure evolution and final properties of Al-Zn-Mg-Cu alloys. Therefore, the following mainly optimizes the temperature and time of the second-stage aging, while fixing the first-stage aging temperature and time at 120°C and 6 h.
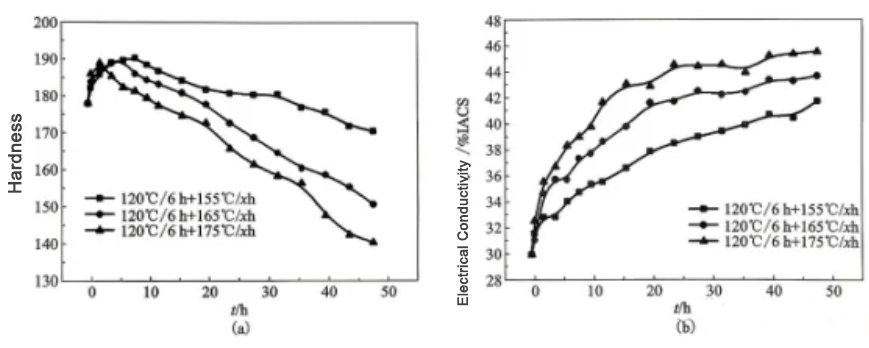
Figure 4 (a) Hardness and (b) electrical conductivity of the alloy as a function of second-stage aging time at second-stage aging temperatures of 155°C, 165°C and 175°C
1 Figure 4 shows the change curves of hardness and electrical conductivity of the alloy with second-stage aging time at second-stage aging temperatures of 155°C, 165°C and 175°C, respectively.
2 As can be seen from Figure 4(a), the hardness of the alloy shows a trend of first increasing and then decreasing with the extension of second-stage aging time. When a higher temperature is used for the second-stage aging, the time for the hardening curve to reach the peak is shortened, and the subsequent hardness decreases faster.
3 As can be seen from Figure 4(b), at the same second-stage aging temperature, the electrical conductivity of the alloy increases continuously with the extension of second-stage aging time. Moreover, the rate of increase of electrical conductivity is faster at higher second-stage aging temperatures.
4 Overall, the change trends of alloy hardness and electrical conductivity with increasing second-stage aging temperature or time are opposite. Therefore, the design idea of two-stage aging is to sacrifice part of the strength in exchange for improvement of corrosion resistance. As can be seen from Figure 4(b), the time required to meet this requirement is different at different second-stage aging temperatures. When the second-stage aging temperatures are 155°C, 165°C and 175°C, the aging times required for the electrical conductivity of the alloy to reach the standard value of 38% IACS are 24 h, 12 h and 6 h, respectively, that is, the required time shortens with increasing second-stage aging temperature. These three time points are all in the declining region of the hardness curve in Figure 4(a). Therefore, if the second-stage aging time is extended on this basis, the electrical conductivity of the alloy will continue to increase, but the hardness of the alloy will decrease to a greater extent. After the second-stage aging treatments of 155°C/24 h, 165°C/12 h and 175°C/6 h, the hardness of the alloy is 180 HV, 183 HV and 182 HV, respectively. Considering performance, time and energy costs comprehensively, 165°C/12 h is a more suitable second-stage aging system for the alloy.
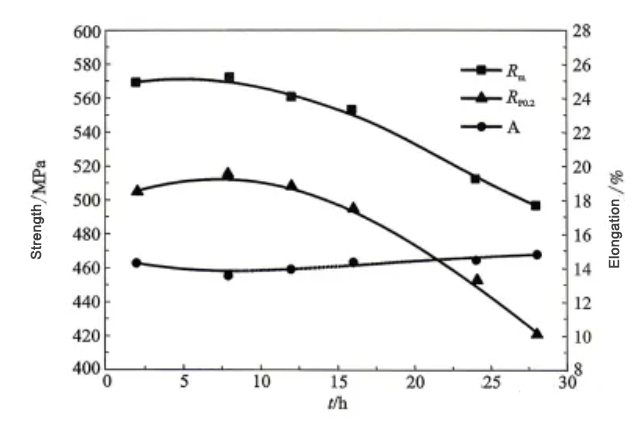
Figure 5 (a) Hardness and (b) electrical conductivity of the alloy as a function of second-stage aging time at different second-stage aging temperatures
2 As can be seen from Figure 4(a), the hardness of the alloy shows a trend of first increasing and then decreasing with the extension of second-stage aging time. When a higher temperature is used for the second-stage aging, the time for the hardening curve to reach the peak is shortened, and the subsequent hardness decreases faster.
3 As can be seen from Figure 4(b), at the same second-stage aging temperature, the electrical conductivity of the alloy increases continuously with the extension of second-stage aging time. Moreover, the rate of increase of electrical conductivity is faster at higher second-stage aging temperatures.
4 Overall, the change trends of alloy hardness and electrical conductivity with increasing second-stage aging temperature or time are opposite. Therefore, the design idea of two-stage aging is to sacrifice part of the strength in exchange for improvement of corrosion resistance. As can be seen from Figure 4(b), the time required to meet this requirement is different at different second-stage aging temperatures. When the second-stage aging temperatures are 155°C, 165°C and 175°C, the aging times required for the electrical conductivity of the alloy to reach the standard value of 38% IACS are 24 h, 12 h and 6 h, respectively, that is, the required time shortens with increasing second-stage aging temperature. These three time points are all in the declining region of the hardness curve in Figure 4(a). Therefore, if the second-stage aging time is extended on this basis, the electrical conductivity of the alloy will continue to increase, but the hardness of the alloy will decrease to a greater extent. After the second-stage aging treatments of 155°C/24 h, 165°C/12 h and 175°C/6 h, the hardness of the alloy is 180 HV, 183 HV and 182 HV, respectively. Considering performance, time and energy costs comprehensively, 165°C/12 h is a more suitable second-stage aging system for the alloy.
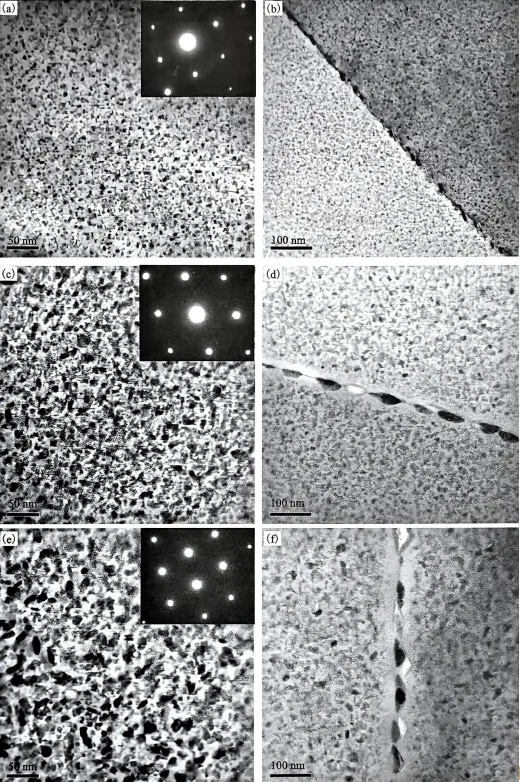
Figure 6 Transmission electron microscopy microstructures of the alloy after different two-stage aging treatments (a),(b) 120°C/6 h + 165°C/3 h; (c),(d) 120°C/6 h + 165°C/12 h; (e),(f) 120°C/6 h + 165°C/24 h
It can be seen from Figures 6(a) and (b) that when the second-stage aging time is 3 h, the intragranular precipitates are mainly fine and dispersed η’ phases, while the grain boundary precipitates are distributed in a continuous chain-like manner. When the second-stage aging time is 12 h and 24 h, the intragranular precipitates of the alloy are η’ phases and η phases, and are mainly η phases. In comparison, after a longer second-stage aging time, the size of the precipitates in the alloy gradually increases, the grain boundary precipitates are discontinuously distributed, precipitate-free zones appear, and their width increases significantly with the extension of aging time.
III. Retrogression and Re-Aging
1 Figure 7 shows the hardness and electrical conductivity curves of the alloy after treatment with different retrogression temperatures and times. To more clearly determine the effect of retrogression, the R (retrogression state) curve and the RRA (retrogression and re-aging state) curve were tested respectively.
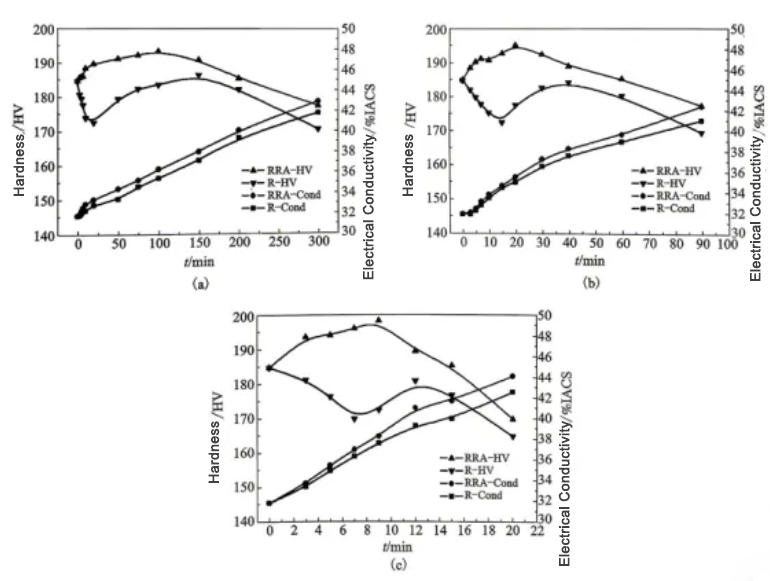
Figure 7 Changes of hardness and electrical conductivity of the alloy with retrogression time at different retrogression temperatures (a) 170°C; (b) 190°C; (c) 210°C
2 From the hardness curves in Figure 7, it can be seen that the hardness R and RRA curves at the three different retrogression temperatures have similar change patterns with retrogression time.
3 From the R curve, it can be seen that the hardness of the alloy after retrogression treatment shows a “decrease-increase-decrease” trend with the extension of retrogression time. From the RRA curve, it can be seen that the hardness of the alloy after retrogression and re-aging shows an “increase-decrease” trend with the extension of retrogression time.
4 At different retrogression temperatures, the hardness values of the RRA curve are higher than those of the R curve, and the peak of the RRA curve appears between the valley and the peak of the R curve.
5 Comparing the three retrogression temperatures, it can be seen that at higher retrogression temperatures, the hardness R and RRA curves of the alloy change more rapidly with retrogression time.
6 When the retrogression temperature is 170°C, the times for the alloy hardness R curve to reach the valley and peak are 20 min and 150 min, respectively, while at 190°C they are shortened to 15 min and 40 min, respectively, and at 210°C they are shortened to 7 min and 12 min, respectively.
7 When the retrogression temperature is 170°C, the time for the alloy hardness RRA curve to reach the peak corresponds to 100 min, while at 190°C and 210°C it corresponds to 20 min and 9 min, respectively.
8 That is to say, the higher the retrogression temperature, the shorter the time required for the alloy R curve to reach the valley (or peak) and for the RRA curve to reach the peak, and the faster the retrogression rate of the alloy.
9 Comparing the change trends of electrical conductivity in Figure 7, it can be seen that at different retrogression temperatures, the change patterns of electrical conductivity of the R-state and RRA-state alloys are the same, both increasing monotonically with the extension of retrogression time, and the electrical conductivity of the retrogression and re-aged alloy is slightly higher than that of the retrogression-state alloy. In addition, as the retrogression temperature increases, the rate of increase of electrical conductivity of the alloy is faster.
10 When the retrogression temperatures are 170°C, 190°C and 210°C, the retrogression times corresponding to the electrical conductivity of the retrogression and re-aged alloy reaching the standard value of 38% IACS are 150 min, 40 min and 12 min, respectively.
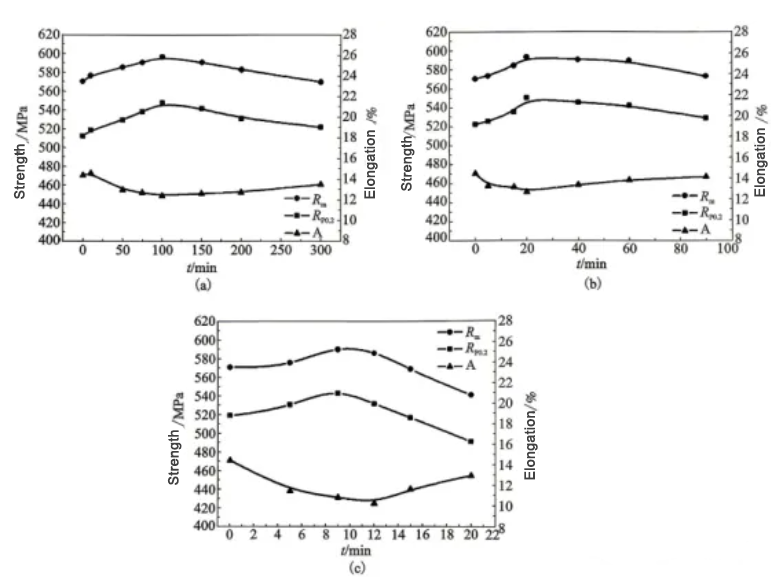
Figure 8 Tensile mechanical properties of the alloy as a function of retrogression time at different retrogression temperatures (a) 170°C; (b) 190°C; (c) 210°C
11 Figure 8 shows the tensile mechanical properties of the alloy after treatment at three different retrogression temperatures of 170°C, 190°C and 210°C. At each retrogression temperature, the strength of the alloy shows a trend of first increasing and then decreasing with the extension of retrogression time. However, the retrogression time corresponding to the peak strength of the alloy varies with retrogression temperature. The peak strength of the alloy at retrogression temperatures of 170°C, 190°C and 210°C appears at 100 min, 20 min and 9 min, respectively, which is consistent with the trend of hardness testing. It can be seen that the higher the retrogression temperature, the shorter the retrogression time required for the alloy to obtain maximum strengthening, and the faster the strength decreases after long-term retrogression. A high retrogression temperature allows the alloy to obtain the strengthening effect faster, but for large-section alloy materials, too short a retrogression time is not conducive to practical operation and is prone to uneven heating. Comprehensive consideration, the suitable retrogression process for the alloy is 190°C/40 min. After aging, the electrical conductivity of the alloy meets the requirements, and the strength and hardness properties do not decrease significantly. Under this condition, the ultimate tensile strength, yield strength and elongation of the alloy are 590 MPa, 545 MPa and 13.2%, respectively, and the hardness and electrical conductivity are 189 HV and 38.3% IACS.
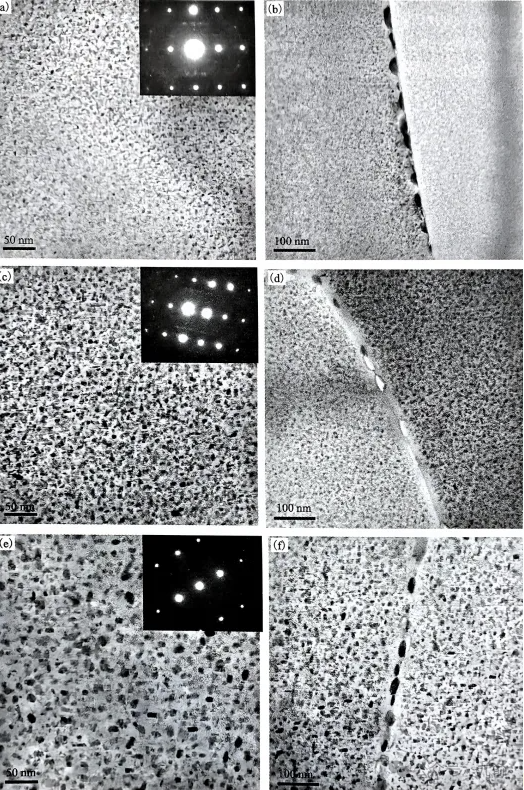
Figure 9 Transmission electron microscopy microstructures of the alloy after retrogression at 190°C for different times (a),(b) 15 min; (c),(d) 40 min; (e),(f) 90 min
12 Figure 9 shows the transmission electron microscopy microstructures of the alloy after retrogression at 190°C for different times. When the retrogression time is relatively short, the intragranular precipitates of the alloy are very fine in size, and the main precipitates are η’ phases.
13 With the extension of retrogression time, the size of intragranular precipitates gradually increases. When the retrogression time is 40 min and 90 min, the intragranular precipitates of the alloy after aging are 3.6 to 5.8 nm and 8.9 to 16.0 nm, respectively.
14 It can also be seen from the figures that after retrogression and re-aging treatment, the precipitates on the grain boundaries of the alloy are all in a discontinuous chain-like distribution, and with the extension of retrogression time, the spacing between grain boundary precipitates increases, the size of grain boundary precipitates slightly grows, and the precipitate-free zones at the grain boundaries gradually widen.
15 Under the optimized retrogression treatment (retrogression at 190°C for 40 min), after aging, the intragranular precipitates of the alloy are fine, dispersed and uniformly distributed, with a size similar to that of the single-stage peak aging state (Figure 3(c)), and finer than that of the optimized two-stage aging state (Figure 6(c)). The grain boundary structure of the alloy shows discontinuously distributed precipitates and a PFZ with a width of about 40 nm, which is similar to that of the two-stage aged alloy.

 Aluminum Extrusions
  Fabrication
 Surface Finishes
 Flat Rolled Aluminum